User Manual
This manual describes how to access data and use the tools on CarrotOmics.
Please use the sidebar on the left to navigate to different parts of the manual, or click on the "Outline" menu in the lower right.
You can access the next page of the manual by clicking on the title of the next page below.
Homepage Overview
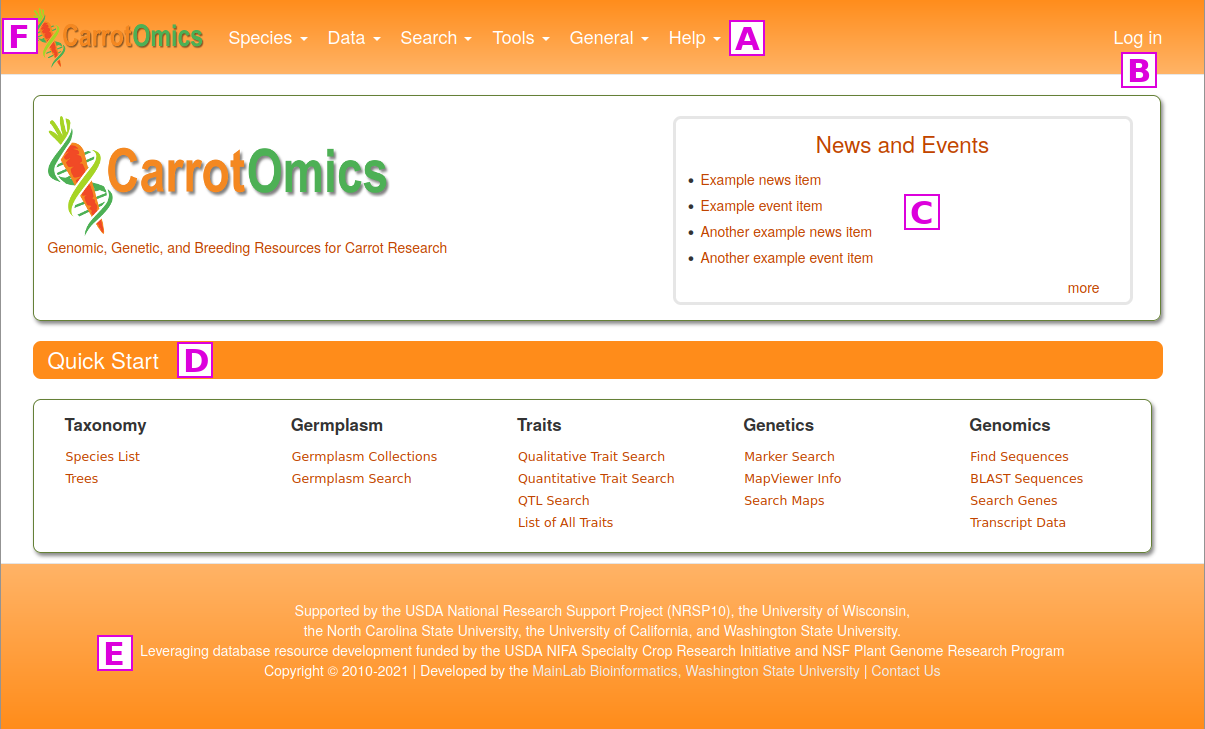
The CarrotOmics homepage is divided into a few key areas to help facilitate navigation.
[A] A traditional pull-down menu bar in the header provides access to all of the site's functionality.
[B] A link to log in to CarrotOmics. This is only used by administrators for uploading new data and performing maintenance.
[C] The center region of the homepage contains a News and Events section which has news about CarrotOmics as well as from the community.
[D] Commonly used functions are provided in the Quick Start section of the home page for easy access.
[E] Funding and technical support information.
[F] You can return to the home page at any time by clicking on the CarrotOmics logo in the upper left corner of the current page.
The items under the Search and Tools menus are discussed in other tutorials, but here we want to highlight the Data, General and Help menus. Under the Data menu [G] you can see a data overview, learn how to submit data, information about the types of genetic markers in CarrotOmics, and transcript and expression data. A summary overview of all data in CarrotOmics which can be broken down by species and/or data type is found on the Data Overview page. Under Data Submission, there are details about submitting data to CarrotOmics. CarrotOmics will accept published data and we highly recommend contacting us before starting to fill in the data templates. There are two links to the contact form on this page.
On the Marker Types page, there is a table of the marker types that are in CarrotOmics. The markers have been generally grouped by the same technologies and we have provided a link to a reference that describes the marker technology.
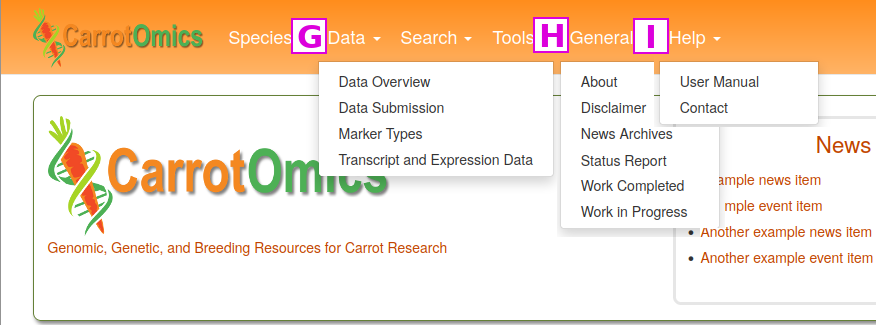
The General menu [H] contains links to a variety of different items.
The Help menu [I] has a link to this CarrotOmics User Manual and video tutorials. There is also a Contact Us link that opens a fillable web form. We appreciate input on the website as well as reports of website bugs and data errors.
Search
Search Functions
There are a number of functions in the Search pull-down menu.
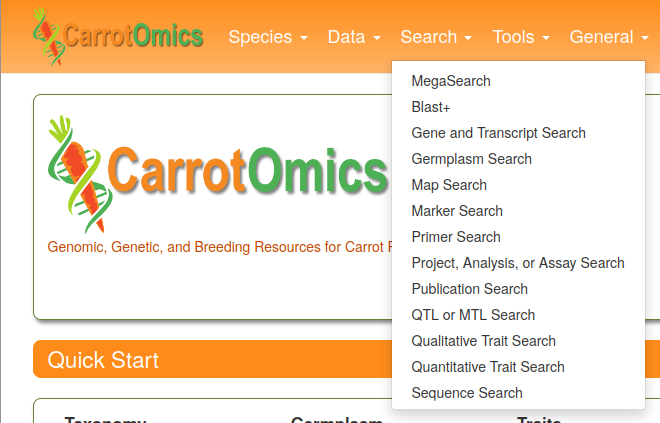
There are three general types of searches available here: MegaSearch, BLAST, and Standard searches. Each of these are described on the following pages.
MegaSearch
MegaSearch functions as a broad-functioning search tool to query a variety of types of information.
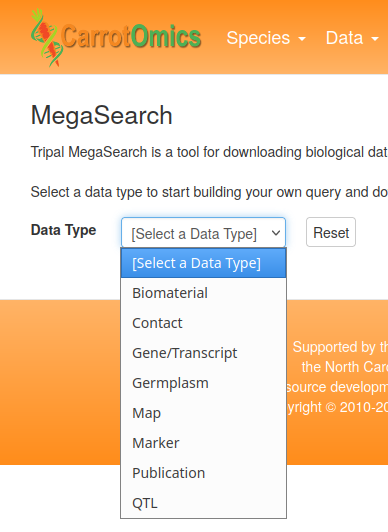
Other information types may be added in the future. Many of these search functions can also be found in individual links in the Search menu, but MegaSearch offers additional ways to subset data. For example, Gene/Transcript searches can be subset by annotations from BLAST, KEGG, InterPro, GO Term, and GenBank.
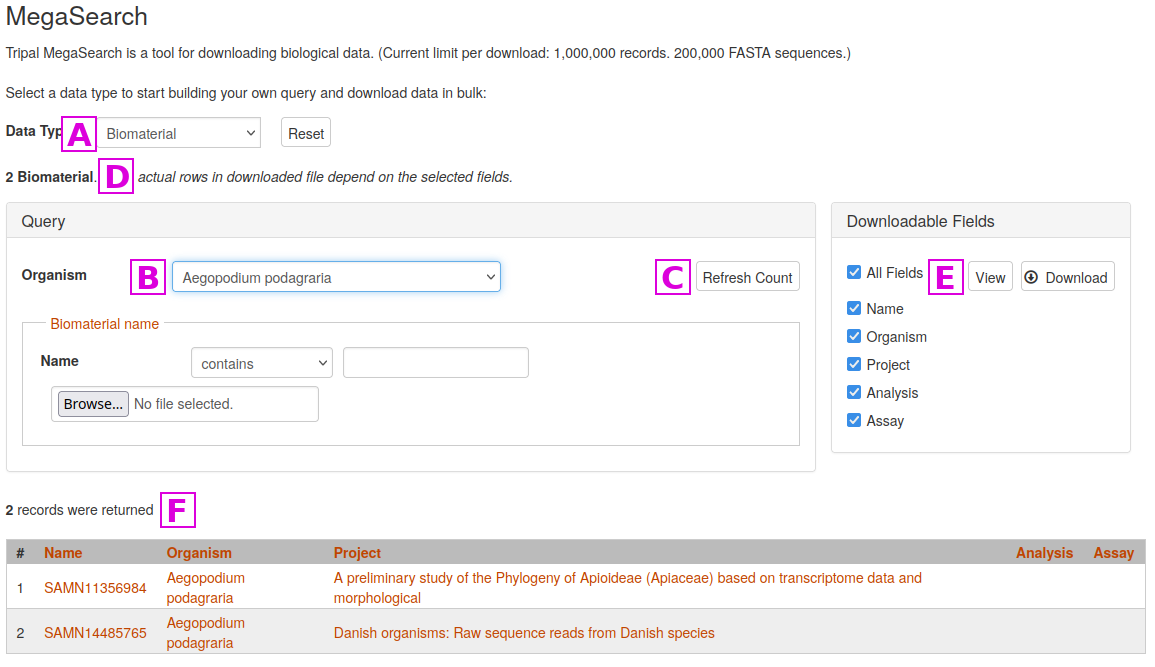
To perform a search with MegaSearch, first select the desired Data Type [A]
Then enter one or more search critera. In this example, we are just specifying the Organism [B]
Results do not appear automatically in MegaSearch. Once criteria are specified, click on the Refresh Count button [C], and the count of the number of results will be updated at [D]
To view the results, click on the View or Download buttons [E]. Here you can also specify which columns appear in the output. If you select the View button, results will appear at the bottom of the screen [F]
BLAST
The Basic Local Alignment Search Tool (BLAST) finds regions of local similarity between sequences. The CarrotOmics BLAST+ tool provides functionality similar to the well known BLAST tool at NCBI as implemented here by the Tripal BLAST module. CarrotOmics provides links to blastn, blastx, tblastn, and blastp analyses.
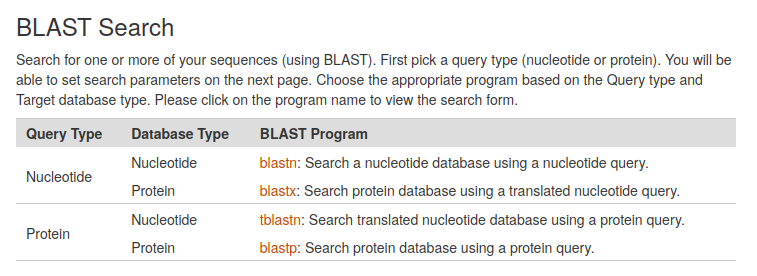
Once the BLAST program of interest has been selected, a query sequence can be entered into a search box, or a fastA file can be uploaded. Users can also select a blast database and specify advanced BLAST algorithm parameters.
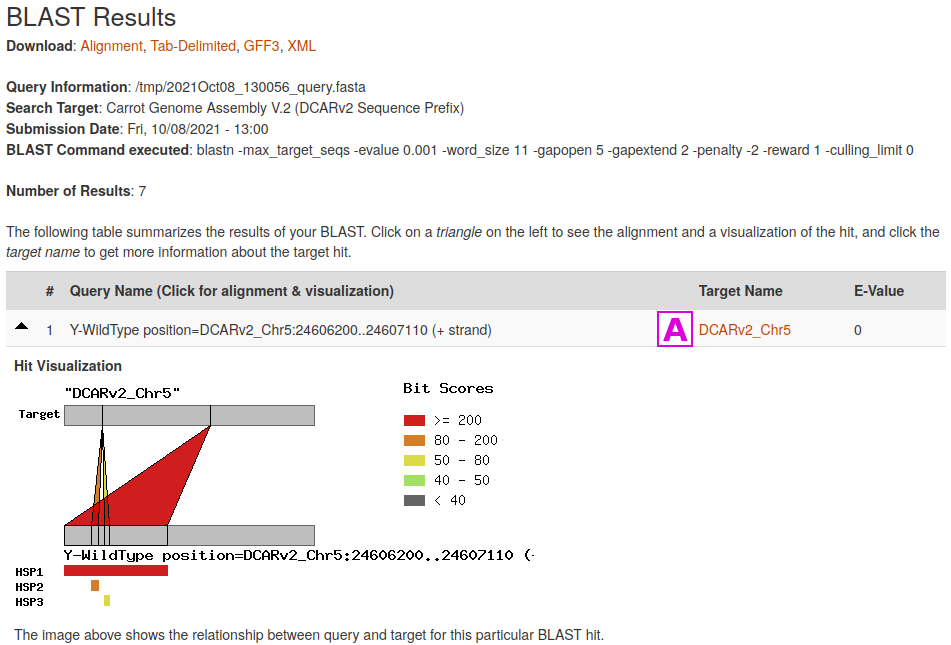
The Tripal BLAST module displays results in an interactive interface, where alignment to the target sequence can be viewed. Features that are in the CarrotOmics JBrowse will have clickable links to their appropriate entries [A].
Standard Searches
The remaining searches listed in the top-level Search menu all utilize similar interfaces.
Germplasm Search can be used to find accessions by name, keywords such as a trait or germplasm collection, taxonomy, country of origin, and cultivar pedigree. Additionally, those accessions with images can be searched by name, plant organ, and year the image was collected.
The Gene and Transcript Search can be used to identify genome features including the NCBI Daucus Annotation release 100, and reference genome gene prediction. Searches can also be completed in specific physical regions, by the name of the gene or transcript, or keywords related to a gene.
Linkage maps uploaded to CarrotOmics are searchable via the Map Search function. Maps can be subset to include only wild carrot (Daucus carota subsp. carota) or cultivated carrot (Daucus carota subsp. sativus). Results of map searches are organized into a table with a link to the map, descriptions of the mapping population including parental accessions, mapping population size and generation. A related search function is Marker Search. Markers can be found based on (sub)species, marker type, mapping population, linkage group, and if available the trait that the marker is associated with from the mapping study or association analysis. “Marker Search” may also be used to identify markers near regions of interest for QTL confirmation of selecting markers to test in genomic-assisted selection.
QTL and MTL Search, Qualitative Trait Search, and Quantitative Trait Search are also search functions related to genetic mapping. QTLs and MTLs can be searched by trait name. Specific traits can also be searched in the “Qualitative Trait Search”, and “Quantitative Trait Search”, differentiated by the traits being categorically or continuously scored, respectively. Searches are guided by drop down menus containing trait names or specific phenotypes scores.
CarrotOmics currently stores 40,497 publication references. These publications represent a subset of the scientific literature of particular interest to Apiaceae researchers, based on relevant keywords and manual curation. Searches for specific topics can be completed on the Publication Search page. Multiple keywords from the abstract, journal name, authors, or title can be used to search for specific Apiaceae topics. For example, searching ‘Carrot’ and ‘Cow’ in the title results in two publications that studied the effect of carrot and/or β-carotene added to the diet of cows.
Published primers can be searched in the Primer Search link from previous analyses, or can be searched either by name or by primer sequence, in either forward or reverse complement orientation, using degenerate base codes if desired. For example, searching with the identifier ‘MYB’ results in four primers related to MYB transcription factors. Finally, specific downloadable data and experimental information can be searched in the Project, Analysis, or Assay Search link.
Taxonomy and Germplasm
Taxonomy
Any type of data in CarrotOmics that references the taxonomy of a particular organism will have a corresponding organism page for that organism. These can be viewed either from the "Species" menu by selecting "Organism Summary", or from the home page Quick Start "Species List". The organisms listed in CarrotOmics have been derived from any of several sources:
- Germplasm accessions from various germplasm collections. See the Collection List for a list of these collections.
- Sequence metadata from the National Center for Biotechnology Information (NCBI)
- Publications containing sequence data or phylogenetic trees (example study).
- Publications containing lists of germplasm (example publication), or germplasm release notices (example publication).
Germplasm
Germplasm accessions can be viewed and searched through the "Search" menu "Germplasm Search" option, or from the home page Quick Start "Germplasm Search". Germplasm accessions can be searched by name, by keywords such as a trait or germplasm collection, by taxonomy, country of origin, and cultivar pedigree. Germplasm accessions will also in some case be found as cross-references on analysis or publication pages.
Biological Samples and Materials
CarrotOmics stores the information about biological samples from NCBI under a corresponding CarrotOmics Biological Sample page, for example SAMN17775433. These pages will link to CarrotOmics analyses and projects, and have references to corresponding NCBI entries. Information about other types of biological samples, such as a plant that has been evaluated for one or more phenotypes, is not represented by its own page, but will be found in the data files linked to the phenotyping project or analysis, for example 2013 Alternaria Resistance Evaluation
Phylogenetic Trees
A list of publications providing taxonomic trees can be accessed from the Trees page. All of the taxonomic trees within a given publication are collected under a single analysis that represents all trees in a publication, for example TreeBASE Study S15477. Each individual tree has a corresponding sub-analysis, listed in the Relationship field, which will ideally further describe analysis methods that were used to generate that tree, and each sub-analysis will have a link to the actual phylogenetic tree.
Traits
Phenotypic traits in CarrotOmics have been obtained from various sources, including the U.S. National Plant Germplasm System GRIN database, publications, and submissions from contributors.
Traits are classified as quantitative traits if the trait is measured numerically on a continuous scale. They are classified as qualitative traits if the trait is measured as discreet steps on a scale, for example scored from 1 to 5, or if the trait has discreet scoring terms, such as color of white, yellow, or orange.
There is a search page for each of these types of traits, the Quantitative Trait Search page, or the Qualitative Trait Search page, both of which are accessible under the top level "Search" menu.
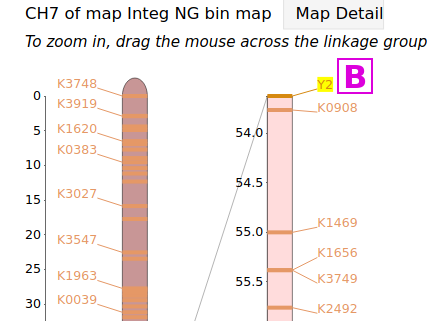
If a trait has been placed on a genetic linkage map, it will have been categorized as a Quantitative Trait Locus (QTL) or as a Mendelian Trait Locus (MTL), and the page for that locus will have a corresponding MapViewer link to view that map. These types of trait markers can be found through the QTL or MTL Search under the Search menu. For example, the page for the MTL Y2 has links to several linkage maps, the map [A], when viewed, shows the Y2 locus at the end of linkage group CH7 [B]

Markers
Most markers in CarrotOmics are associated with one or more genetic linkage maps. The various types of markers known are listed on the CarrotOmics Marker Types page.
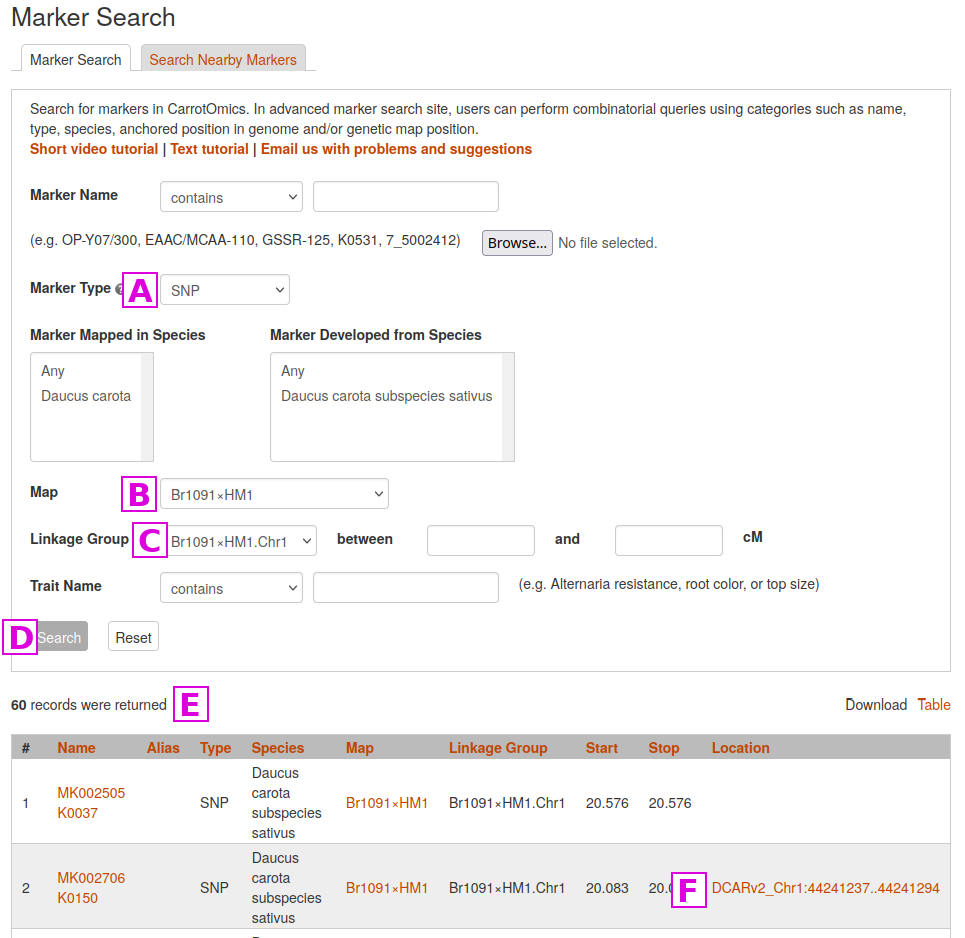
Desired markers can be found using the Marker Search page. There, markers can be subset by subspecies, marker type, mapping population, linkage group/chromosome, or a trait the marker is associated with.
In the example presented below, we will limit our search to SNP markers [A]
in one specific linkage map [B]
on one specific linkage group [C]
and then click on the Search button [D]
The results of the search are displayed at the bottom of the screen [E]
For markers with known genome locations, a link to the CarrotOmics JBrowse will appear [F]. Clicking on this link will take you to the genome location where the marker is located
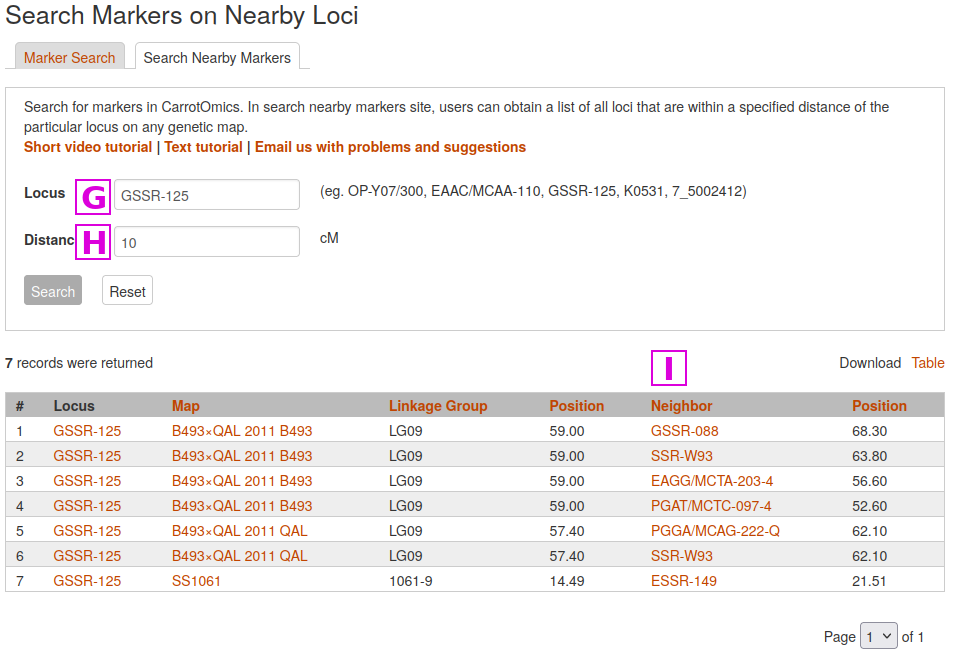
Another useful function is to Search Nearby Markers, where a marker name can be used to identify markers within a user-defined genetic distance. In the following example, we will search for markers near GSSR-125 [G]
that are within 10 cM [H]
Nearby markers are listed in the Neighbors column [I]
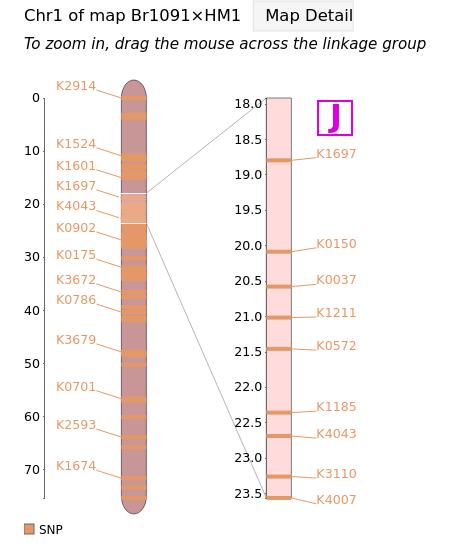
Marker pages can also be accessed directly from the linkage map(s) they are contained in. For example, any of the marker names in column [J] of the map below can be clicked to lead you to the corresponding marker page.
MapViewer
CarrotOmics strives to have all published linkage maps for carrot available in the database. The maps are visualized using MapViewer.
MapViewer is a tool for viewing and comparing genetic maps using the Tripal MapViewer module version 2. Tripal MapViewer is a modern replacement for the cmap program which has not been updated since 2009.
The MapViewer Quick Start can be accessed from the Tools menu in the header, and on this page there are links to example maps and correspondence matrices. Maps can also be reached from the Map Search under the Search menu. Alternatively, from the Marker Search page, selected markers will display a link to any linkage map that they are present in. The Map Overview pages for each of the maps display summary graphics of all linkage groups, and clicking on a linkage group opens a more detailed view in MapViewer.
MapViewer displays the complete linkage group on the left, and the selected region on the right. The selected region can be changed by dragging and resizing a window on the complete linkage group on the left side. There is a legend of the marker colors below the linkage group figure. Information about the markers is displayed in the upper right corner when the pointer is over a marker name on the right side graph. Clicking on the marker name on the rights side graph, opens the marker details page.
A different map or linkage group can be displayed using the controls at the bottom of the MapViewer page. The color of the markers and which markers are displayed can be changed with the controls. The ruler and marker positions can also be toggled on or off. After changing any of the four parameter sections, the Submit button must be pressed to display the changes.
Pictures from MapViewer
MapViewer allows users to export figures as a high-resolution PNG file that is suitable for publication. Items that can exported have a clickable camera icon that will trigger a file download. Users can export the map overview which has all the linkage groups (Fig. 1), a single linkage group (Fig. 2), a linkage group comparison (Fig. 3), a dot plot (Fig. 4) or a correspondence matrix (Fig. 5).

Figure 1. How to download a map overview.

Figure 2. How to download a linkage group figure.
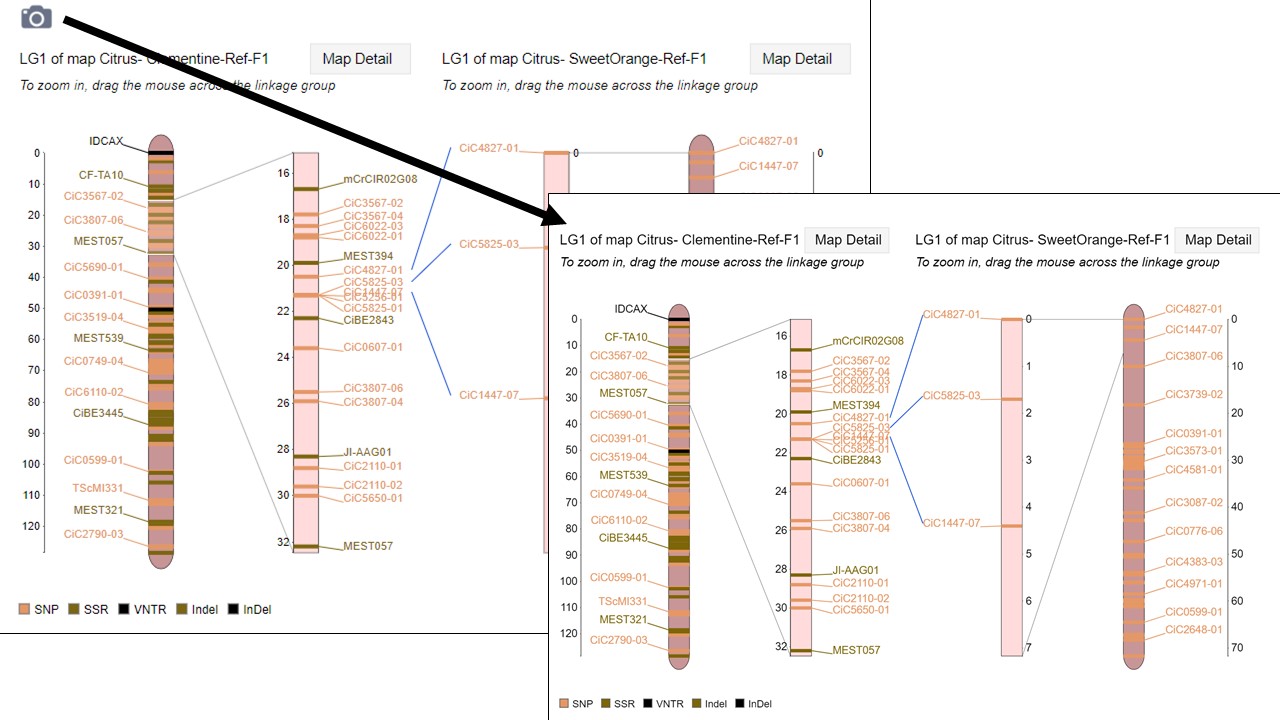
Figure 3. How to download a linkage group comparison figure.

Figure 4. How to download a linkage group comparison dot plot.

Figure 5. How to download a linkage group comparison correspondence matrix.
Data Download, Web Services, and BrAPI
CarrotOmics has data download links associated with any content type which includes data files. You can search for downloadable files at the File Search page. A summary of some of the more "popular" downloads is available on the Data Download page.
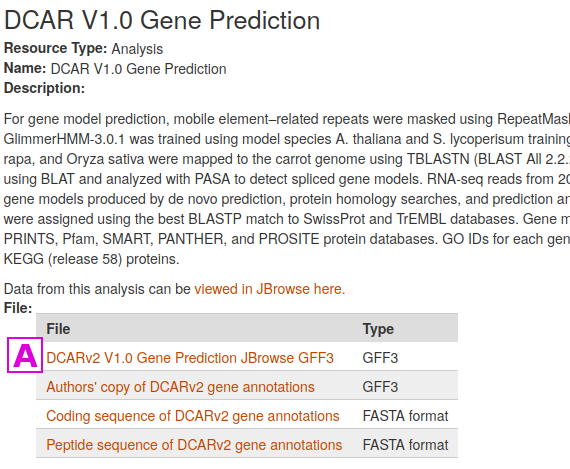
In the following example we will search for a gene prediction analysis. Go to the home page, and on the Search menu select Project, Analysis, or Assay Search
In the Name box, enter DCAR V1.0 Gene Prediction and click on the Search button
The search results should provide a link to DCAR V1.0 Gene Prediction. If we click on this, we see that this analysis has links for downloading various files.
Select the first one [A] "DCARv2 V1.0 Gene Prediction JBrowse GFF3" by clicking on the link in the File column
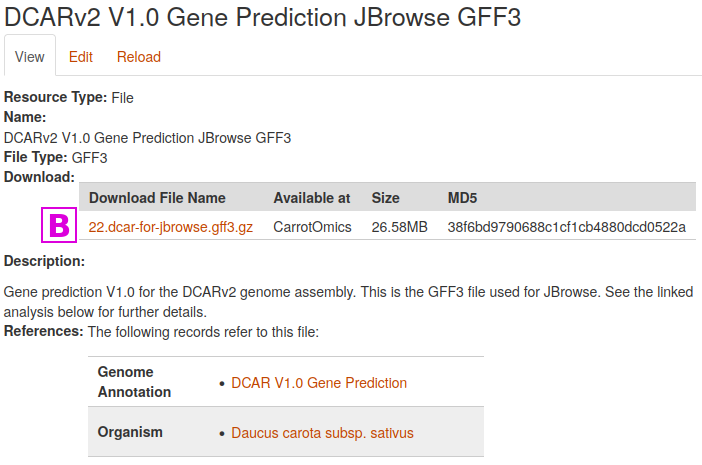
This leads to the page for that file. Simply click on the link [B] in the Download File Name column to download the file. File size and an MD5 checksum are provided for most files stored at CarrotOmics.
Web Services
In addition to the main web interface, CarrotOmics provides a way to programmatically access all available data using RESTful web services. These web services are designed to support the following:
- Allow end-users to access data programmatically using any language of their choice.
- Allow Tripal sites to share data among themselves.
Web services for Tripal are meant to be:
- Fully discoverable
- Searchable
- Provide access to the same data as that which appears on the visible content pages.
- Adjustable via Drupal’s content management interface (i.e. no programming required for existing content)
- Provide a programmers API for easy addition of new content.
- Share data the way scientists expect to see it.
- Use controlled vocabularies to ensure maximal interoperability.
You can access the CarrotOmics web services at https://www.carrotomics.org/web-services/
This initial resource “home page” of the web services returns results in JSON format. When using the JSONView extension within Firefox you can explore web services by clicking the links that are present in the browser.
For more detailed information consult the Tripal Web Services documentation at https://tripal.readthedocs.io/en/latest/user_guide/web_services.html
Breeding API (BrAPI)
The Breeding API (BrAPI) project is an effort to enable interoperability among plant breeding databases. BrAPI is a standardized RESTful web service API specification for communicating plant breeding data. The BrAPI home page https://brapi.org/ describes BrAPI in more detail.
CarrotOmics supports BrAPI through the Tripal BrAPI module https://github.com/tripal/brapi and currently supports version 1.2 of the BrAPI standard. Unfortunately, not all BrAPI calls are currently supported. Contact us with requests for additional supported calls.
Relevant BrAPI pages on CarrotOmics:
Video Tutorials
Please check out the tutorial videos on the MainLab YouTube channel. The searches and tools use very similar frameworks across all of the MainLab databases.